 Digressive Celts
We Need to Talk About Martin: Celtic’s season so far in numbers
Celtic are creating as much as their past title-winning sides, but they’re doing it without the ball. We explore how.
By Larry Nerd
Generally, the best teams create lots of chances. They often do this by having lots of the ball. Or maybe they have lots of the ball because they’re the best. Either way, these teams find themselves in a specific situation a lot: organised attacks.
For most of the last five seasons, Celtic have done this well. In their four title-winning seasons under Ange Postecoglou and Brendan Rodgers, from 2021/22 to 2024/25, Celtic made between 69 and 75% of the total passes in their league matches, and between 79 and 83% of the total completed passes in the final third.
However, this Celtic team are not doing that and things look different.
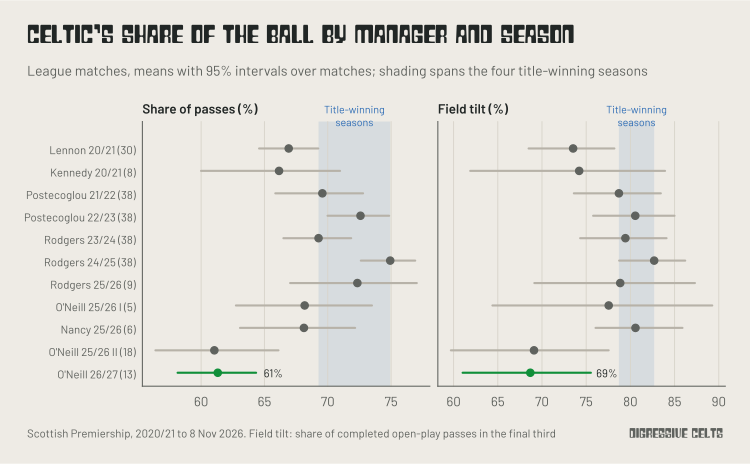
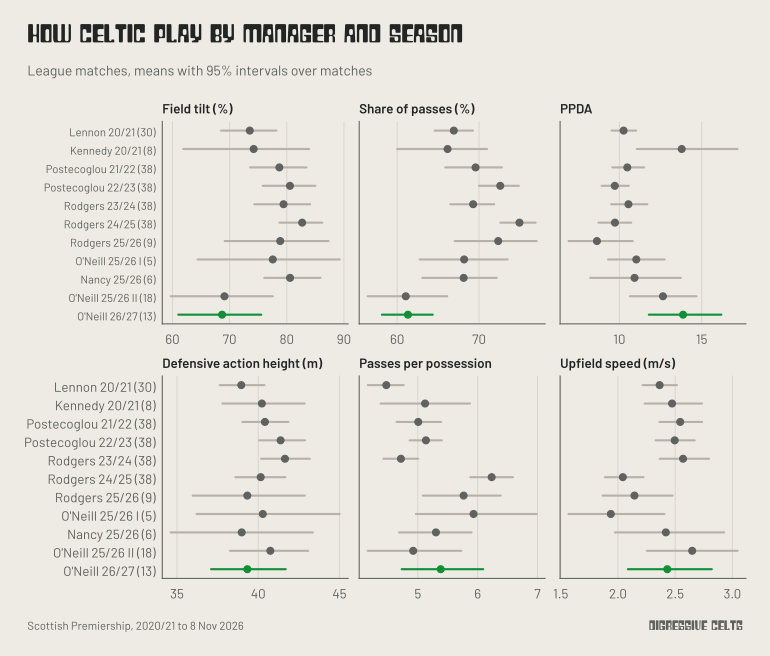
This season, Celtic have made 61% of the total passes in their league matches, and 69% of the completed passes in the final third, which is known as field tilt*. Both are well below every title-winning season. This low began with Martin O’Neill’s second interim spell last season.
*Field tilt is the share of both teams’ completed open-play passes that are made in the final third.
This doesn’t mean Celtic aren’t creating chances, though.
Thirteen league matches into 2026/27, Martin O’Neill’s Celtic are creating 2.60 non-penalty expected goals (npxG) a match, more than in any full season since 2020/21.
Some of that is a league quirk of this season. Across the Scottish Premiership, teams are taking about 17% more shots per match this season than at the same point of the last six seasons on average (between 13 and 22% more than each of them). Once we allow for that, O’Neill’s Celtic create about as much as the Postecoglou and Rodgers sides that won the league.
There are two distinct differences, though. The first is that—at the other end—they are conceding 1.05 npxG, more than in any full season in that time. The second is how they are creating their chances in front of goal.
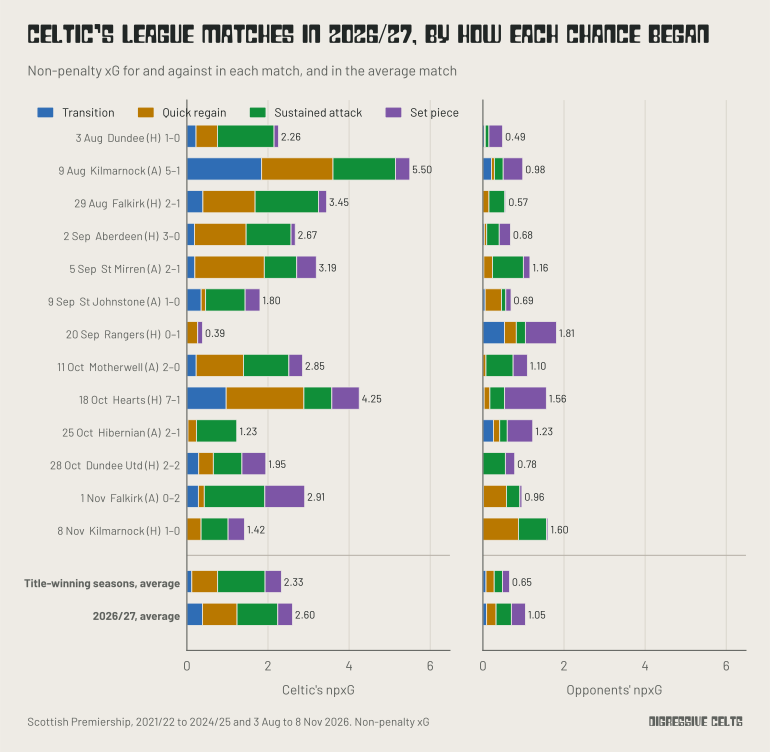
This is every Celtic league match so far this season, split by how each chance began, with the average match at the bottom. Blue and amber are chances that came from winning the ball back, and there are more of these chances this season: 1.24 npxG in this season’s average match, against 0.76 for the title-winning sides.
This Celtic side create as much as previous title-winning sides. They do it with a squad estimated to be worth less than Rangers’, and a younger one than last season’s. But more of their chances come from countering than from sustained attacks (1.24 npxG a match against 1.00): they are more reliant on individual skill than systematic routines. They don’t control games, and they concede more.
This article explores each of those in turn: how good the team is, what it has to work with, where the chances come from, why, against whom, and who does it.
Data & Definitions
We used event data for every Scottish Premiership match from 2020/21 to 8 November 2026. We grouped Celtic’s matches by manager and season. That gives us Neil Lennon’s last season, John Kennedy’s eight matches in charge, two seasons each for Postecoglou and Rodgers, and then 2025/26, which had Rodgers, O’Neill, Wilfried Nancy, and O’Neill again. O’Neill’s current side is the 13 league matches of 2026/27.
Within each match, we labelled shots based on their context. A set piece is a chance from a corner, free kick, or throw-in, including the phase of play that follows it. A transition is a shot within 15 seconds of winning the ball from an opposition move of three or more passes. A quick regain is the same, but after a scrappier spell of fewer than three opposition passes, which is mostly second balls and won-back clearances when a team is already on top. Everything else in open play is a sustained attack.
Raw numbers flatter this season, so for most of our comparisons we compared each Celtic match with what every other team did against the same opponent that season. A team that everyone creates chances against gives Celtic less credit for doing the same. This controls for both the fixture list and the league-wide rise in shots.
We also joined the event data to three other sources. Market values come from Transfermarkt, which gives nearly every professional player a value (that tends to predict transfer fees well [1]). Team strength comes from our own Elo ratings, the same ones we used in Just Be Good. Further details are in Appendix A.
Expected Goals (xG): Shot probabilities summed up; the number of goals you would expect a team to score from the quantity and quality of chances created.
NP: non-penalty; excludes penalties for a less noisy sample (e.g. npxG is non-penalty xG).
Field tilt: A team’s share of both teams’ completed open-play passes in the final third.
PPDA: Passes [allowed] per defensive action; the number of opposition passes a team allows before making a defensive action on average.
Attack and defence against the same opponents
Against the same opponents, the attack is no weaker than it was.
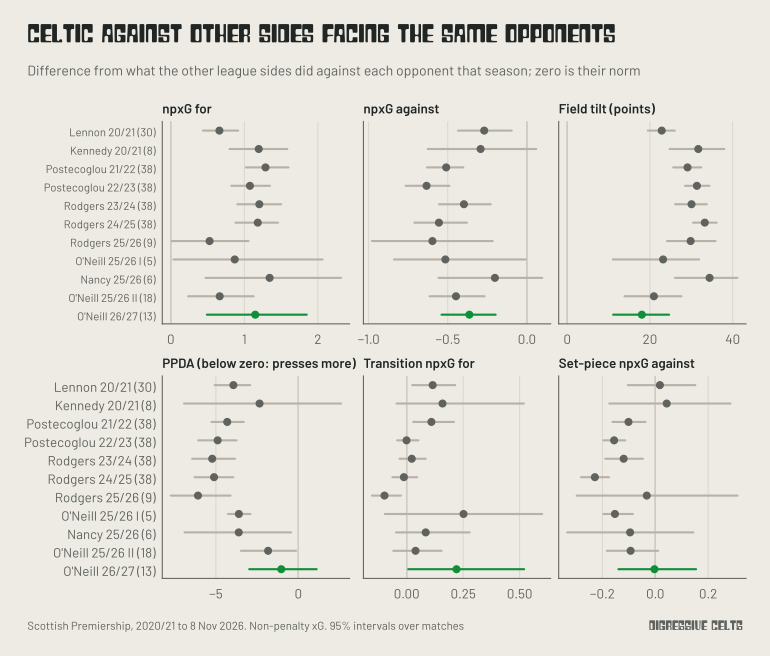
Each row is a manager-season, and zero is what other teams did against the same opponents. O’Neill’s side create 1.15 npxG a match more than other teams do against the same opponents. The four title-winning seasons sat between +1.08 and +1.29, so this season is in the right ballpark.
The interval for this season is wide, from +0.49 to +1.85, because thirteen matches is not many (we come back to this at the end). But there is nothing here to suggest the attack has fallen away.
The defence, however…
Well, we’ll come back to that too.
Squad value and age
Celtic are—unusually—not doing this with the most valuable squad in the league.
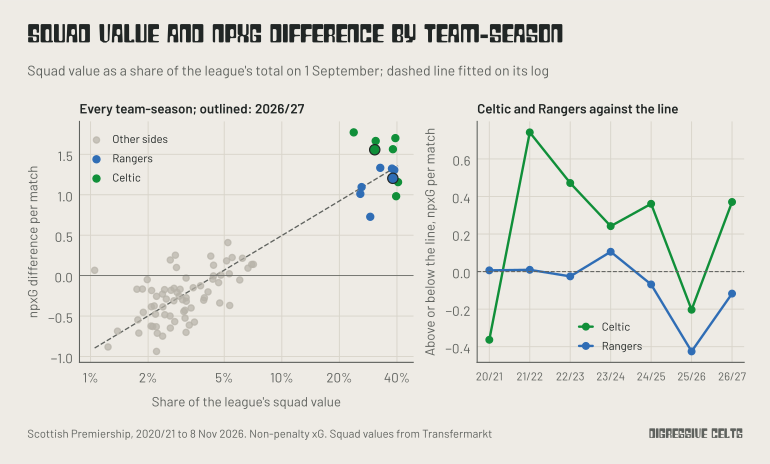
We took each team’s share of the league’s total squad value on 1 September and set it against its npxG difference per match. Teams with more of the league’s value create more and concede less.
This season, Rangers hold 38% of the league’s squad value and Celtic 31%. That is the first time since 2022/23 that Rangers’ squad has been worth more. Celtic still sit 0.37 npxG a match above the line for a team with their share. Rangers sit 0.12 below it.
The last two times Rangers had the more valuable squad, in 2021/22 and 2022/23, Postecoglou’s Celtic sat 0.74 and 0.47 above the line. They won the league both times.
Notably, that period—like this one—was the beginning of what feels like a rebuild with new players centred. This could partly explain the lower value.
Further, a season’s squad value alone is a fairly blunt measure because a team doesn’t always field its best players. To address this, we also valued every starting XI on the day of each match.
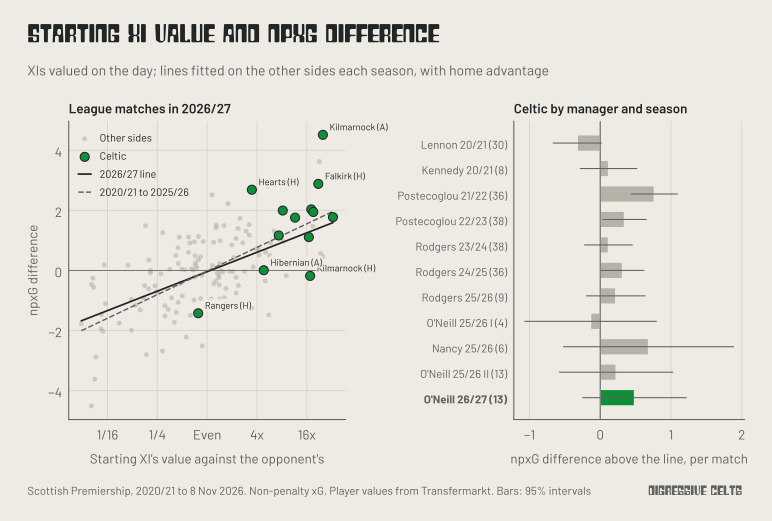
For each season, we fitted how a team’s npxG difference in a match relates to the value of its starting XI against the opponent’s, plus home advantage. We fitted it on the other eleven teams only, so Celtic’s own matches don’t factor into the comparison. We then measured how far Celtic sat above or below that line, match by match.
This season’s Celtic are 0.49 npxG per match above it. Amongst full seasons, only Postecoglou’s first, in 2021/22, was higher, at 0.77. Nancy’s six matches came out at 0.68, but with an interval far too wide to read much into.
This season’s interval runs from −0.25 to +1.22. It crosses zero, so after thirteen matches we can’t rule out that this side are simply doing what their XI’s value predicts that they should.
On average, Celtic’s starting XI has been worth about ten times their opponent’s this season. That is about the same gap as under Rodgers in 2023/24 and 2024/25 (about 11 times). Postecoglou’s first side, the one furthest above the line, had about five times.
One check that the model behaves sensibly: home advantage comes out at −0.07 npxG a match in 2020/21, when stadiums were empty, and between +0.43 and +0.65 in every season since.
Celtic’s squad is also younger than in recent seasons.
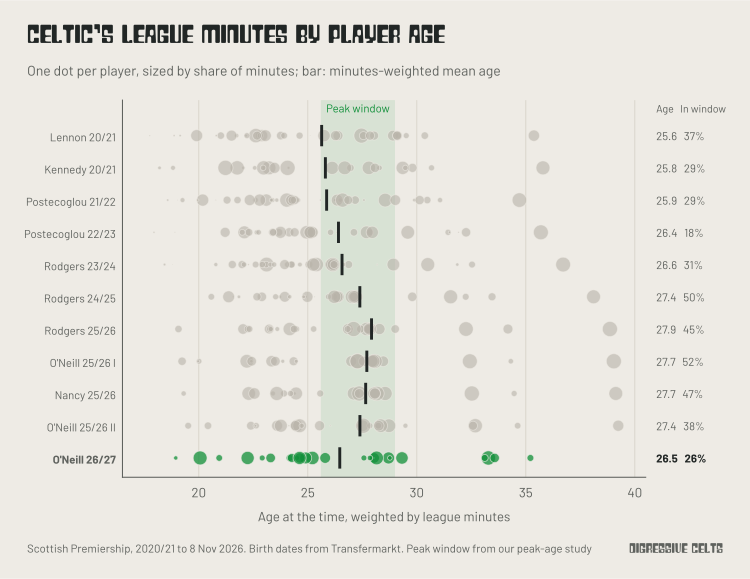
Each row in the plot above is a manager-season. Each dot is a player at their average age that season, weighted by minutes, and sized by their share of league minutes. The shaded band runs from 25.6 to 29.0. In our peak-age study, The Kids Are Alright, market value peaked at 25.6 and the strength of the club a player plays for peaked at 29.0, with performance on the pitch peaking in between.
Celtic’s average age rose every season from 2020/21, from 25.6 under Lennon to 27.9 under Rodgers at the start of 2025/26. This season it is 26.5, about the same as Postecoglou’s second side (26.4). This supports the idea of this being a rebuilding era—the natural shift between squad cycles.
Only 26% of this season’s minutes have gone to players inside the band, against between 38 and 52% in every spell last season. It is, of course, possible to win the league without a majority of peak-age players: Postecoglou’s sides had about as few or fewer (29% and 18%).
Where Celtic create chances
Celtic’s method of chance creation has shifted.
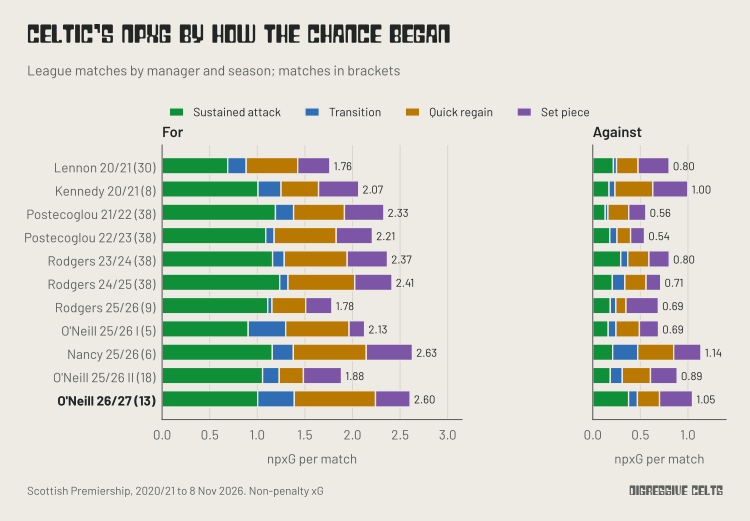
Under Postecoglou and Rodgers, between 0.09 and 0.19 npxG a match came from transitions. This season, 0.38 has come from transitions. That is 0.22 a match more than other teams manage (against the same opposition), where the previous title-winning seasons ranged from −0.01 to +0.11. Quick regains are up too, to 0.85 a match. Sustained attacks, which made up about half of those earlier sides’ chances, are down to 1.00, the lowest of any full season since Lennon’s in 2020/21.
Against the same opposition, sustained attacks are responsible for a net +0.51 per match, against +0.68 to +0.87 in the title-winning seasons. So the same overall total is being reached via a different route: fewer chances from long spells of pressure, and more from countering.
Moving the ball into dangerous areas, which is what sustained attacks are built on, is down a little too. Celtic add 0.64 more expected threat* (xT) a match than other teams do against the same opponents, against 0.79 to 0.93 in the title-winning seasons.
*Expected threat gives every area of the pitch a value: how likely a team with the ball there is to score within its next few actions [2]. A pass or carry that moves the ball from a low-value area to a high-value one adds threat.
That is unusual for a team in Celtic’s position.
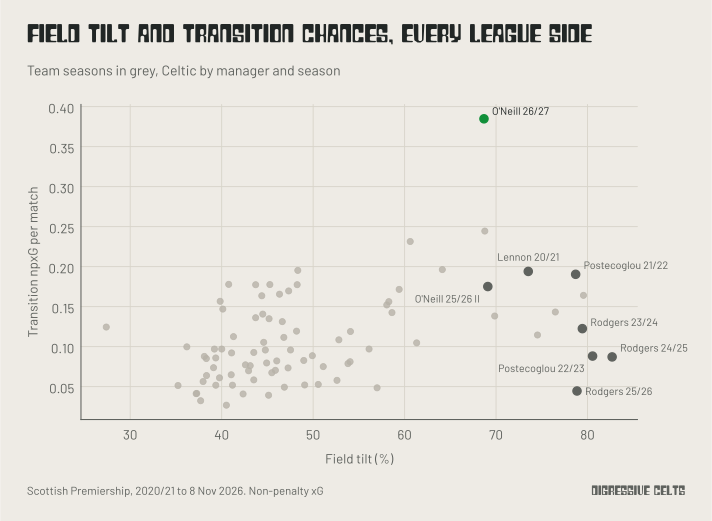
Better teams tend to create more of everything, including transitions, so the league’s strongest sides sit to the right of this chart (with more field tilt) and a little higher (with more transition npxG). O’Neill’s Celtic sit far above all of them. At 0.38 npxG a match, they have the most from transitions of any team-season in the league since 2020/21. The next highest is Rangers in 2024/25, at 0.24.
This isn’t a quirk of where we drew the line around a transition, either. We tried every combination of a window from 5 to 30 seconds and a minimum of one to five opposition passes for our definition. This season’s side have more transition npxG than all four title-winning seasons in all 30 of them (Appendix B). The magnitude of the effect moves with the definition, but its direction holds in all of them.
This isn’t all bad, of course. Transitions are generally more likely to result in a goal (as the defence is less organised) than slower, more elaborate attacks [3]. The issue is the sustainability of this approach as the dominant team in a league. It is much easier to prepare for a sustained attack—where you can rehearse near exactly in training—than transitions which are much more, for lack of a better word, vibesy.
Where Celtic win the ball before these chances has changed too.
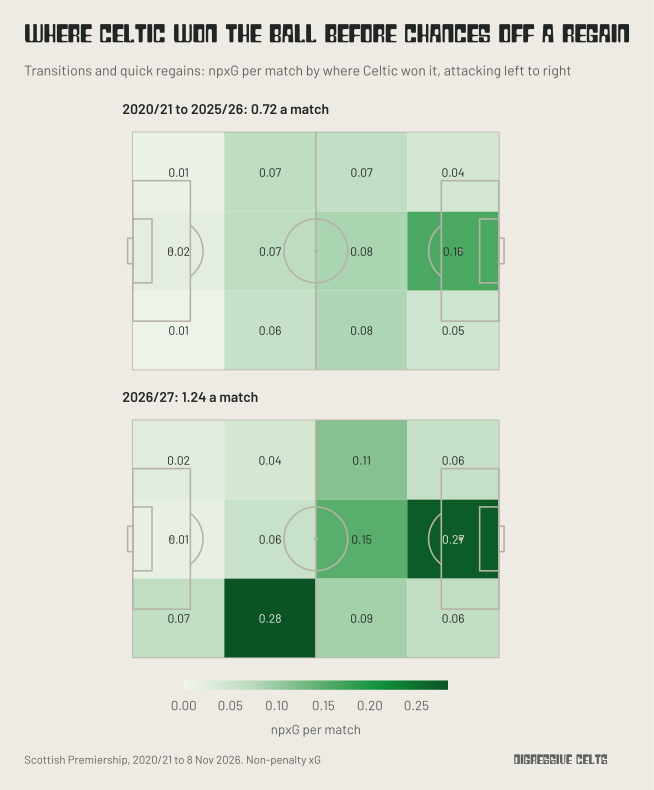
Chances from a regain, which are transitions and quick regains together, have resulted in 1.24 npxG a match this season for Celtic, against 0.72 across the six seasons before. Two areas stand out. The first is the right side of Celtic’s own half, between 26 and 52 metres from their goal (which is responsible for 0.28 a match this season against 0.06 before). The second is the centre of the pitch around the opposition box (0.27, against 0.16), which looks more like the high pressure of the earlier sides.
We can also see who wins the ball and starts the most valuable transitions.
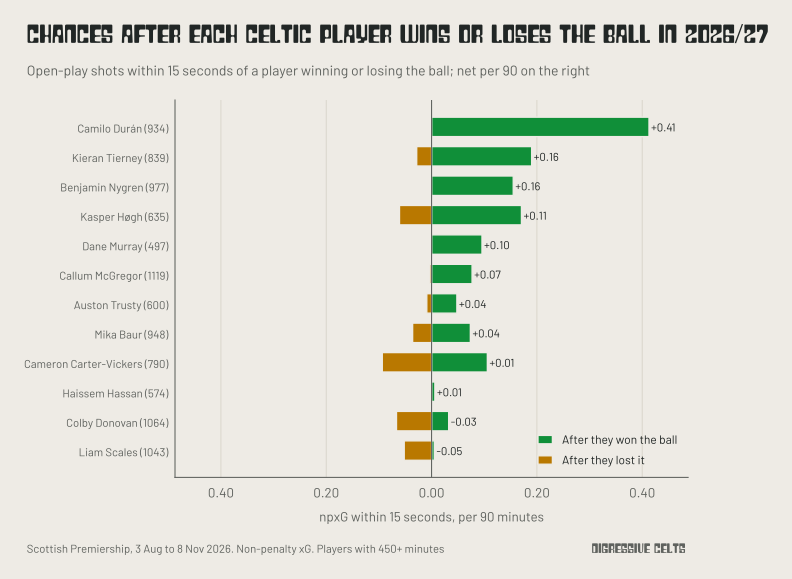
For every Celtic shot within 15 seconds of winning the ball in open play, we credited the npxG to the player who won it instead of the one who shot. We did the same in reverse for the opposition’s chances within 15 seconds of a Celtic player losing it. Green bars are chances made this way, per 90 minutes, and amber bars are chances given away.
Camilo Durán stands out. Celtic have had 16 shots, worth 4.28 npxG, within 15 seconds of him winning the ball. That is 0.41 per 90 minutes, more than twice anyone else. Kieran Tierney and Benjamin Nygren are next, at +0.16 each once their losses are taken off.
At the other end, Liam Scales has lost the ball before 10 opposition shots, worth 0.60 npxG, more than any other player. Colby Donovan’s losses have led to only four shots, but they were worth 0.79.
Territory and game state
The fall in territory began before this season.
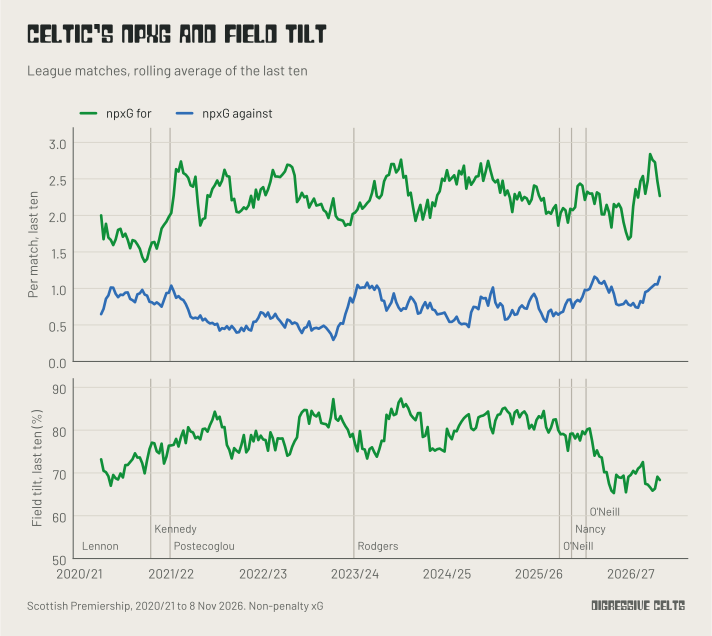
Over any ten-match run from 2021/22 to the end of 2025, Celtic’s field tilt mostly sat between about 75 and 85%. It fell in early 2026, after O’Neill’s second spell began, to between 65 and 73%, and it has stayed there since. Because the drop came part of the way through last season and has carried on into this one, it doesn’t look like an effect of this season’s fixtures.
Against the same opponents, this season’s field tilt is 18 points above other teams’, against 29 to 33 points in the title-winning seasons.
They also move the ball less.
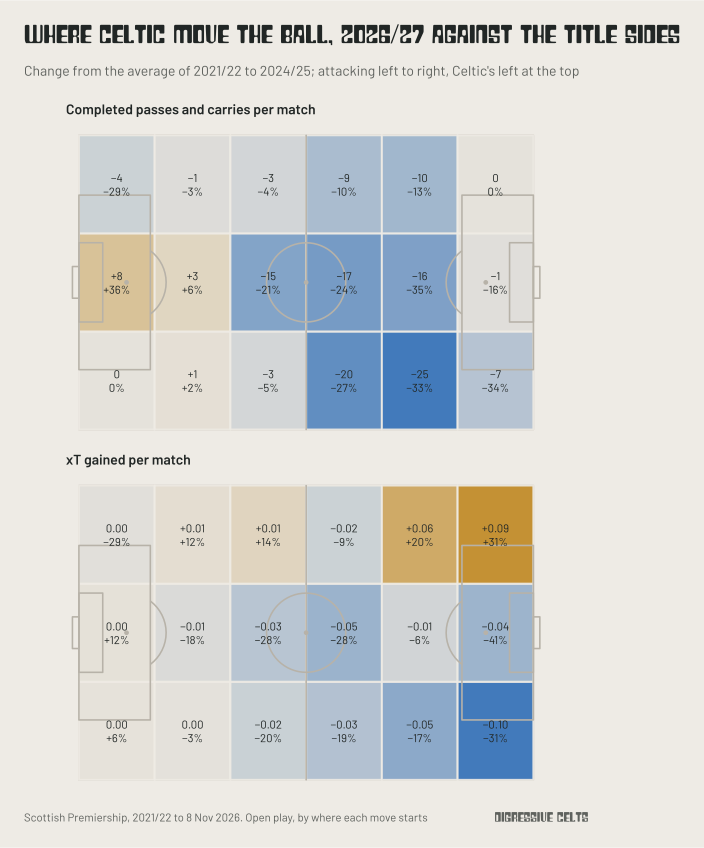
Each zone shows how far Celtic’s completed passes and carries, and the threat they add, have changed from the average of the four title-winning seasons. Celtic complete 747 passes and carries a match this season, against 866 for those sides.
Between a quarter and a third fewer moves start on the right of the opposition half, and between a fifth and a third fewer through the centre. On the left of the opposition half, the drop is about a tenth, and the threat added in the two zones nearest the box is up, by 20 and 31%.
They also press less. Their PPDA* this season is 13.9, against between 9.7 and 10.6 in the title-winning seasons.
*PPDA, or passes allowed per defensive action, is the number of passes the opposition make in their own 60% of the pitch for each tackle, interception, challenge, or foul made against them there [4]. A higher number means the opposition get more passes before they are challenged, so less pressing.
In the first chart in this article, PPDA is shown as a difference from what other teams did against the same opponents, which is why it is negative. Below zero means Celtic allowed fewer passes per defensive action than other teams did, so pressed more. Every Celtic side since 2020/21 has been below zero. This season’s −1.0 is the closest any has come to zero, against −4.3 to −5.2 in the title-winning seasons, and its interval runs from −3.0 to +1.1, which crosses zero indicating that this side’s pressing is not clearly different from an average Scottish Premiership side’s against the same teams.
Another interesting point is that most of the drop in territory comes when Celtic are winning.
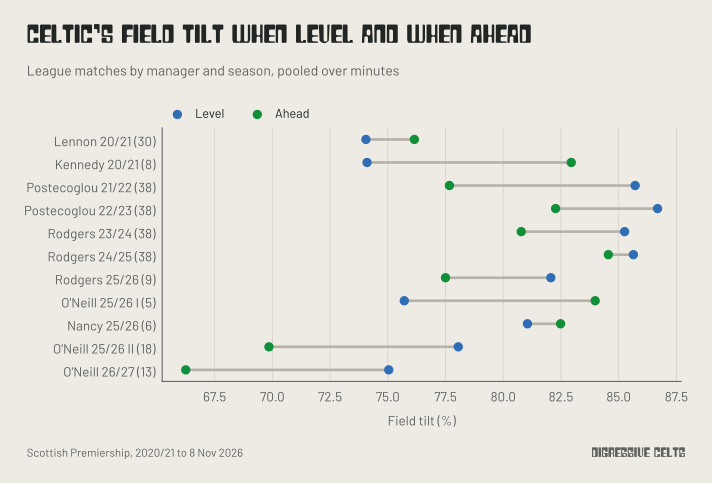
When the score is level, this season’s Celtic have 75% field tilt. When they are ahead, it drops to 66%. In the title-winning seasons, field tilt dropped by between 1 and 8 points with a lead, from 85 to 87% when level, and it never went below 77%.
Teams generally have less of the ball when they are winning than when they are losing [5], so some sitting on a lead is normal. But O’Neill’s Celtic do it more than any recent Celtic side. They have also been ahead for 55% of their minutes this season, so it pulls the season’s averages down a long way.
The drop starts as soon as they score.
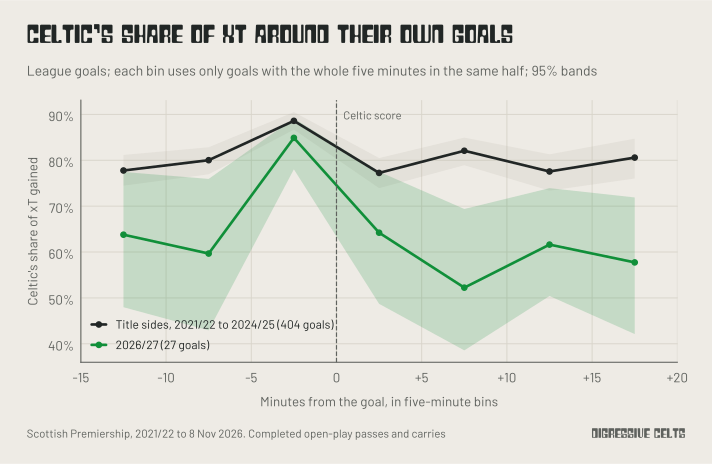
We took each league goal Celtic have scored and measured their share of the threat that both teams added, in five-minute spells from 15 minutes before the goal to 20 minutes after. For the four title-winning sides together, Celtic’s share was 84% in the 15 minutes before a goal and 79% in the 15 minutes after. This season, it was 73% before and 59% after.
That’s a drop of 14 points, against 5. The confidence intervals are wide given the small sample, but it indicates that the earlier sides barely changed after they scored while this one drops off.
It isn’t all game state, though. Even when level, 75% is about ten points below those earlier sides. Perhaps it is intentional—for some reason—but it seems more likely that Celtic are not able to manage games after they score in terms of territorial control.
Opponent strength
A team that waits to win the ball needs the other team to have it, and to give it away. Some opponents do that more than others.
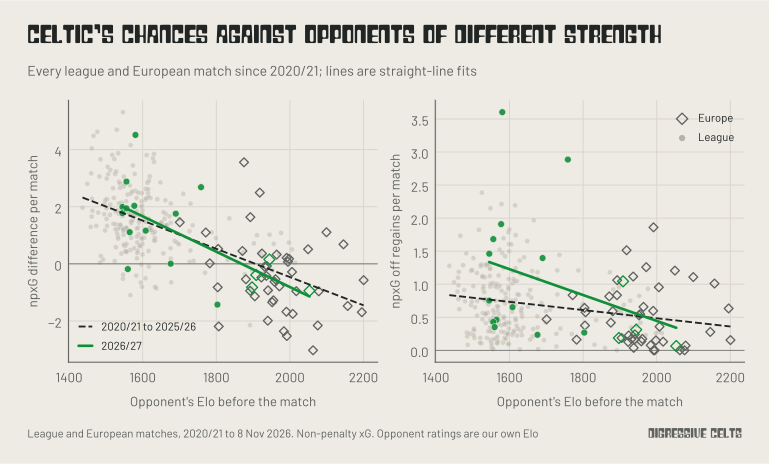
Each dot is a Celtic match since 2020/21, in the league or in Europe, placed by the opponent’s Elo rating before kick-off. The left panel is npxG difference. The right panel is npxG from transitions and quick regains together. One line is fitted to 2020/21 to 2025/26, and the other to this season.
Before this season, Celtic’s chances from winning the ball barely depended on the opponent. The line falls from 0.76 npxG a match against a team rated 1,550, about where Dundee and Aberdeen are this season, to 0.45 against a team rated 2,050, about where Benfica are.
This season, the same line falls from 1.33 to 0.35. Against Rangers (0.27), Celta Vigo (0.19), and Benfica (0.06), Celtic got almost nothing from winning the ball. The exceptions among the stronger teams are Hearts at home (2.89 npxG from regains in a 7–1 win) and Beşiktaş at home (1.04 in a 3–2 win).
The overall npxG difference falls a little faster with the opponent’s strength than before, too: 0.62 a match for every 100 Elo points this season, against 0.49.
So this way of playing has done most of its damage against the weaker teams in the league. Those are most of the teams Celtic play, which may be why the totals look as good as they do. This season’s line rests on only 17 matches, and the four strongest opponents were all in Europe.
Europe is where Celtic meet strong teams most often, so we looked further back there.
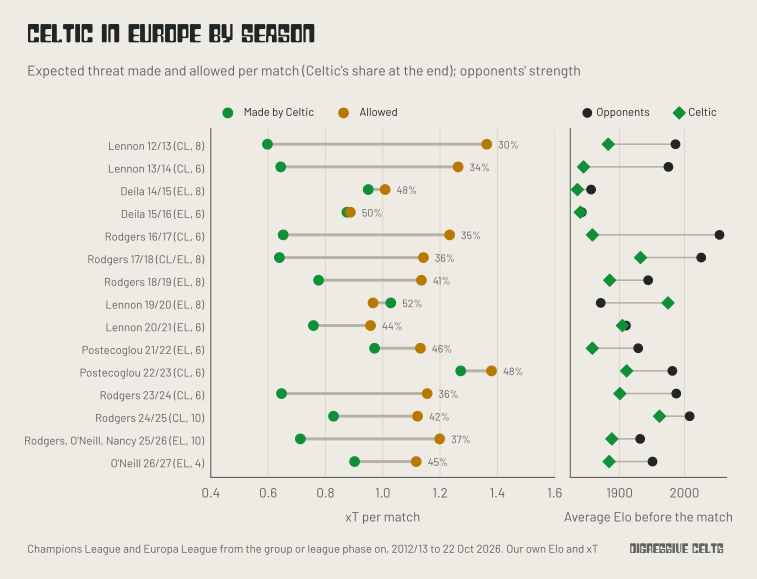
We have no xG for European matches before 2020/21, so we used expected threat, which needs only the passes and carries. The left panel shows the threat Celtic made and allowed per match in each European campaign since 2012/13, and Celtic’s share of it. The right panel shows how strong Celtic and their opponents were.
In the league since 2020/21, Celtic have made 1.63 xT a match and allowed 0.51, a share of about three-quarters. In Europe, no campaign has gone above 52% (Lennon in 2019/20). This season’s four matches come out at 45%, sixth of 15 campaigns, against opponents rated about 70 points above Celtic on average. Celtic lost the first three and beat Beşiktaş 3–2.
So in Europe this side have held a fair share of the threat. Chances from winning the ball dried up in the first three matches and came back against Beşiktaş. Four matches is far too few to say more than that.
Defence
Giving up territory has a cost at the other end.
Against the same opponents, O’Neill’s side concede 0.36 npxG a match fewer than other teams do. That is a little short of Rodgers’ first season back (−0.40), and not as good as Postecoglou’s two seasons (−0.51 and −0.63) or Rodgers’ second (−0.56). They also allow more shots: 2.9 a match fewer than other teams against the same opponents, where the title-winning seasons allowed between 4.8 and 6.0 fewer.
The extra is mostly not coming from being caught on the break. Opposition chances off a regain are worth 0.33 npxG a match against Celtic this season, against 0.30 over the six seasons before. Instead, it comes from set pieces and sustained attacks. Sustained attacks against Celtic are responsible for 0.38 npxG a match, more than in any full season since 2020/21 (0.13 to 0.29 in the title-winning seasons).
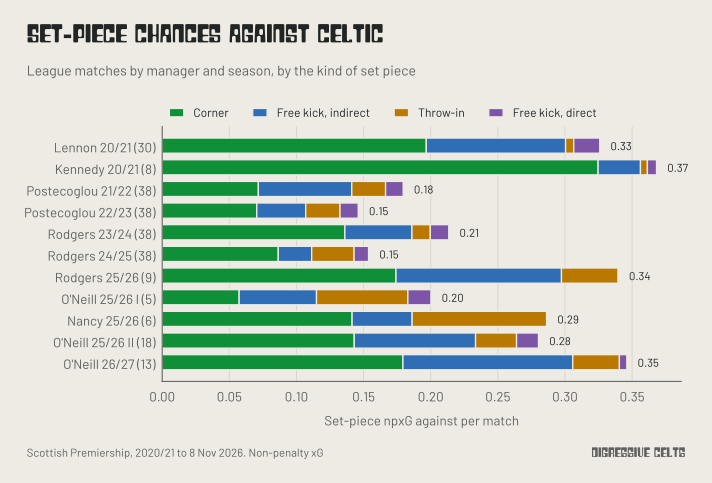
Set pieces are the biggest single change. Celtic have conceded 0.35 npxG a match from set pieces this season, 0.18 of it from corners and 0.13 from indirect free kicks. From 46 shots, that has produced four of the ten league goals they have conceded.
Again, some of this is the league. Every team has conceded between 0.29 and 0.52 npxG a match from set pieces this season, and Celtic rank eighth of 12. Against the same opponents, Celtic’s set-piece defending is almost exactly average (0.00 a match), where every Postecoglou and Rodgers season was between 0.10 and 0.23 a match better than average. So Celtic’s set-piece defending has gone from clearly better than the league’s norm to about average.
In open play, it’s harder to diagnose where the issues might be. We can look at the location of the final passes before shots for more information on where Celtic leak chances.
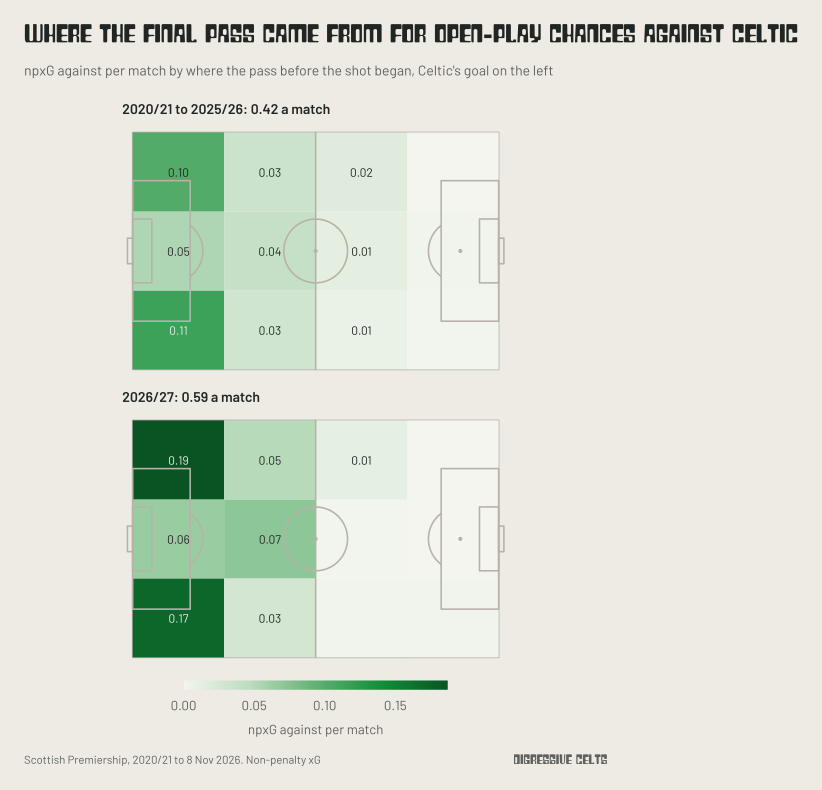
Open-play chances against Celtic that came after a completed pass are up from 0.42 to 0.59 npxG a match. Most of the increase comes from the wide zones nearest Celtic’s goal. That is 0.17 a match from Celtic’s right (0.11 before) and 0.19 from their left (0.10 before). Before this season, the right was a little worse than the left. Now both flanks are up, the left slightly more. Passes from the centre of Celtic’s own half have also nearly doubled, from 0.04 to 0.07 a match. The rise is spread across both flanks and the middle rather than one spot, which suggests the team might just be less organised in defence in general.
Players and the left side
Not everything has changed with this manager specifically.
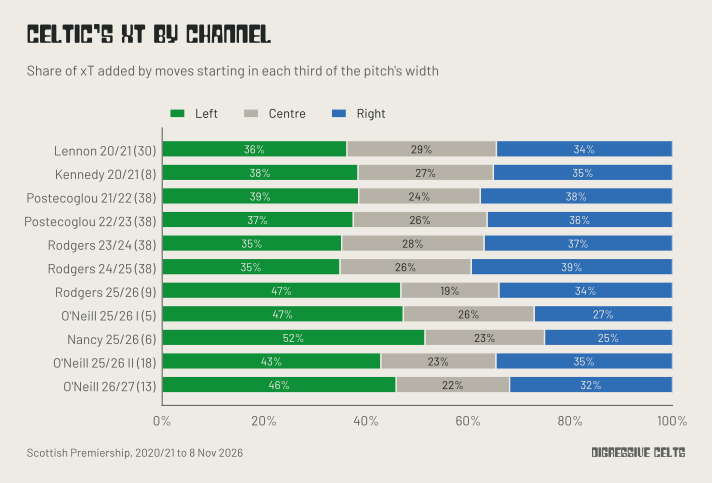
This season, 46% of Celtic’s threat comes from moves that start on the left of the pitch, against between 35 and 39% in every season up to 2024/25. But this didn’t start with O’Neill. It has been between 43 and 52% in every manager-season since the autumn of 2025: Rodgers’ last nine matches, O’Neill, Nancy, and O’Neill again.
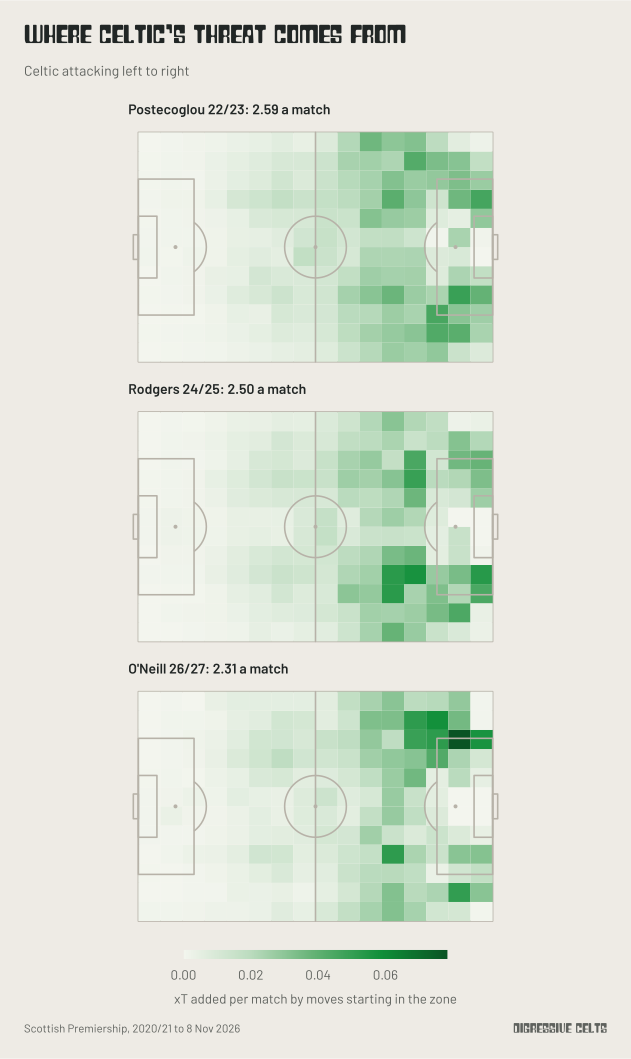
Similarly, the hottest attacking area this season is the left corner of the opposition box, and the two players who add the most threat from there are Sebastian Tounekti and Kieran Tierney. Tounekti has done it in only 285 league minutes, mostly from the bench (below the 450-minute cut-off for the next chart, and too few minutes to tell skill from luck).
Regardless, the left-side bias persisting across managers is likely player-related rather than any specific tactical plan. This might simply be, as the graph below indicates, an effect of the increase of left-footers in the team.
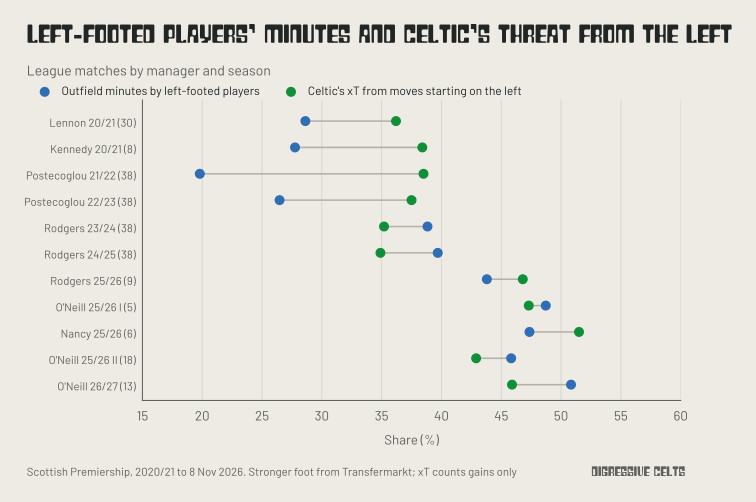
There is an interesting trend on the right, too.
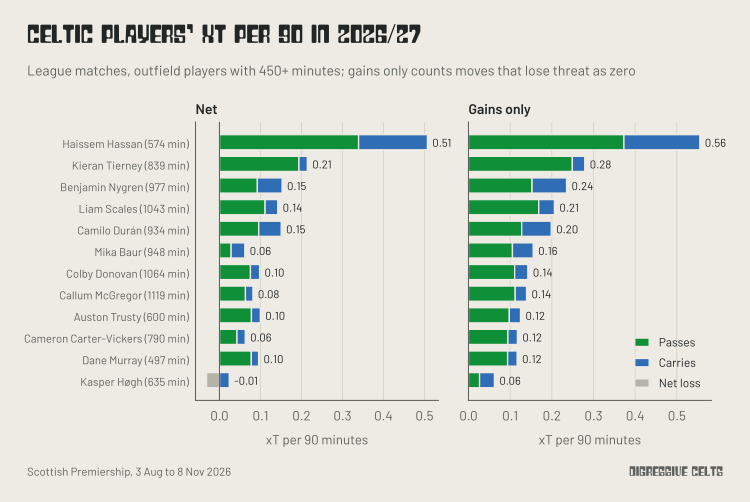
Per 90 minutes, Haissem Hassan, on the right, adds the most threat: 0.51 xT, or 0.56 taken as only positive values to stop back passes masking progressive actions. Tierney is next (0.21 and 0.28), then Nygren (0.15 and 0.24). The gap between the two values is the threat a player loses by moving the ball to less dangerous areas. Mika Baur has the biggest gap, 0.06 net and 0.16 counting gains only, so many of his moves lose threat.
Losing threat isn’t inherently bad; a player might recycle possession aimlessly but they might also do it with strategic intent, to move the opposition and open a pass elsewhere. Tracking data possession value models can better understand longer-term effects by predicting the chance of scoring at different horizons, but we couldn’t source tracking data for this work so we’re stuck with this estimation.
The passes between players show the same pattern as the threat trends.
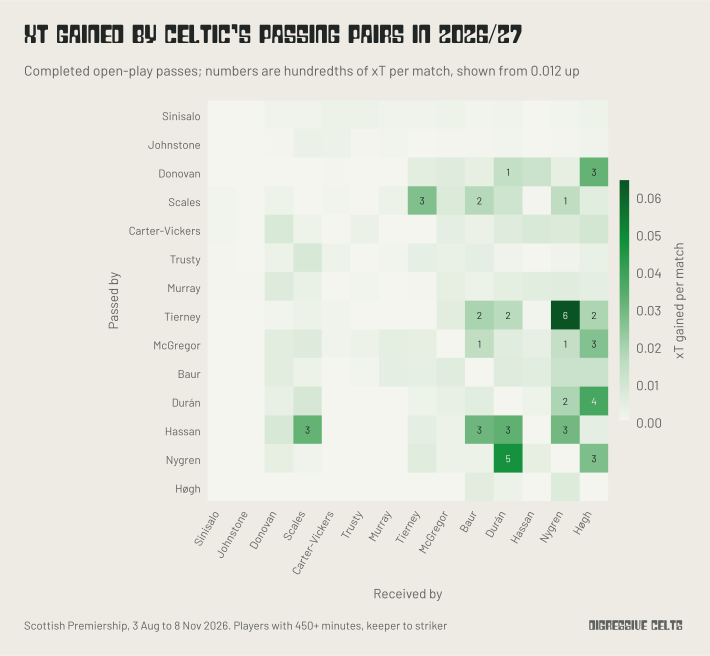
Each square is the threat added per match by completed open-play passes from the player in the row to the player in the column. The biggest pair in the side is Tierney to Nygren, at 0.064 xT a match, the left-back to the attacking midfielder. Next is Nygren to Durán (0.047).
Hassan’s passes spread wider: to Durán (0.033), to Scales (0.032), to Baur (0.030), and to Nygren (0.029). The passes to Scales are mostly crosses that Scales won in the air.
Hassan’s numbers stand out across the whole league, not just at Celtic.
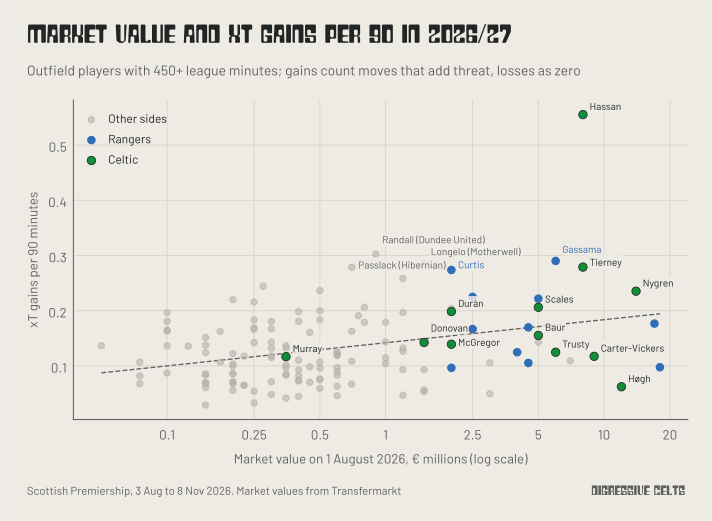
We set every outfield player’s market value on 1 August against the threat they have added per 90 minutes this season, for the 138 with at least 450 league minutes. Hassan adds more than anyone in the league, 0.56 xT per 90, and was valued at €8m. Nygren, the most valuable of these Celtic players at €14m, adds 0.24.
By the way Hassan plays, this is fairly intuitive. He’s incredibly fast, dribbles a lot (6.9 take-ons per 90 minutes, the most in the league), and so consistently takes the ball from less dangerous areas to more dangerous areas. You would expect some productivity to follow. He has no goals and one assist, against 0.92 npxG and 3.0 expected assists, so that is likely to catch up. The more pertinent question from his play is whether his decision-making is good: whether he takes the ball into the right dangerous areas at the right time, and chooses the best mode of chance creation when he arrives. That is, again, hard to assess with just event data. Either way, he progresses the ball in an absolute sense a lot.
Kasper Høgh (€12m, 0.06) and Cameron Carter-Vickers (€9m, 0.12) sit low. But a striker and a centre-back aren’t expected to add much threat this way, so that says more about the measure than about them.
Results and sample size
Finally, the match results.
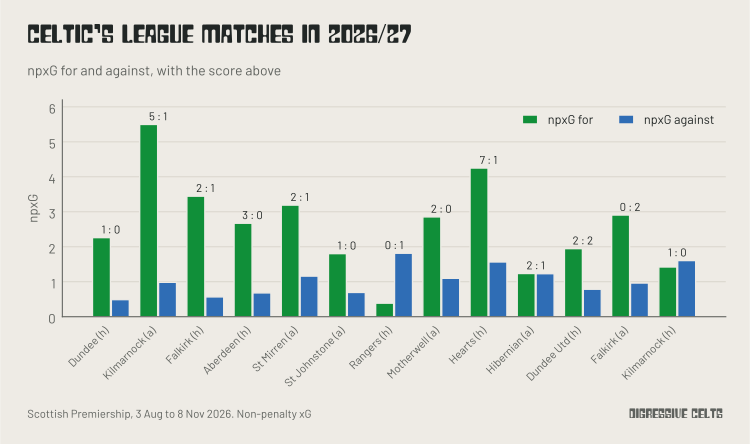
In their last three league matches, Celtic drew 2–2 with Dundee United, lost 2–0 at Falkirk, and beat Kilmarnock 1–0 at home. They scored three from 6.3 npxG and conceded four from 3.4. Against Kilmarnock, they created less than they gave up (1.42 npxG to 1.60).
Over the season, they have scored 28 and conceded ten, from 33.9 npxG for and 13.6 against. One goal each way was an own goal, and one of the ten conceded was a penalty. The one defeat where the chances agreed with the result was against Rangers at home (0.39 npxG to 1.81).
Celtic’s goals have come up short of their npxG in sustained attacks, which have produced seven goals from 13.1 npxG. Transitions and quick regains have produced 14 from 16.1. Over so few matches, this is more likely to be noise than a pattern. You wouldn’t expect this to indicate any kind of finishing shortcoming (disparities between goals and xG very rarely do). Over the next period of the same number of games, it would be surprising for Celtic to not score at a more similar rate to expected. The two barriers to that being worth celebrating are: 1) their expected rate could well decline, given the over-reliance on transitions, and 2) even if it doesn’t, their defensive frailties could still cause bigger issues.
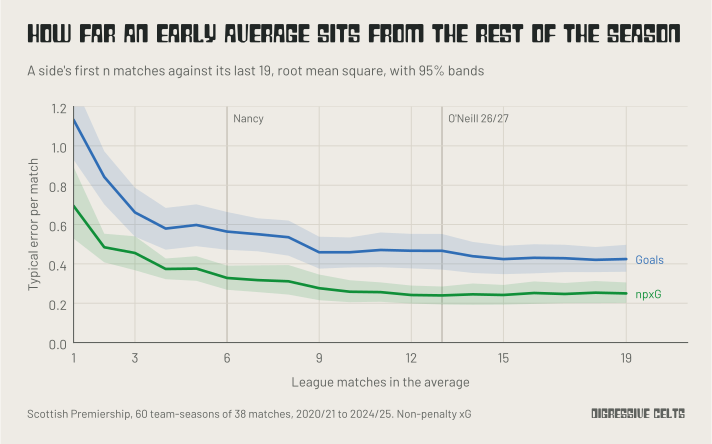
We can inspect how predictive these numbers are after thirteen games. To do this, we checked how close a team’s average over its first few league matches gets to its average over the last 19 of the season, for every 38-match season from 2020/21 to 2024/25. After one match, a team’s npxG per match is typically 0.69 away from where it ends up. After six, it is 0.33 away, and after 12, 0.24, after which it barely improves. Goals are much noisier: even after 19 matches, a team’s goals per match are typically 0.42 away, which is worse than npxG after six. This is the main reason xG is a better guide than results to how a team is playing over short spells [6].
So just over ten matches is around where npxG starts to tell us something. It is enough to say which way things point at the very least: this side create as much as the title-winning sides, more of it in transition, and they concede more. It is not enough alone to say by how much. The squad-value and opponent-strength results rest on the same thirteen matches, so the same goes for them. It is also why Nancy’s six matches, which look extreme in some of the charts above, can’t tell us much on their own (Appendix C).
The best teams usually create their chances from organised attacks, with lots of the ball. For most of the last five seasons, that was Celtic. Thirteen matches into this season, O’Neill’s side create as much with far less of it.
So far, it adds up to about the same going forward. But it has worked best against the teams that give the ball away. Celtic give up more of the ball once they lead, and they concede more at the other end.
We still make Celtic favourites for the league, as does the market (just about). But it’s a high-variance playing style that is by no means guaranteed to cruise the league. We will check again at the winter break, when there should be about 20 matches to go on.
References
[1] Herm S, Callsen-Bracker H-M, Kreis H (2014). When the crowd evaluates soccer players’ market values: Accuracy and evaluation attributes of an online community. Sport Management Review, 17(4), 484–492. https://doi.org/10.1016/j.smr.2013.12.006
[2] Singh K (2019). Introducing Expected Threat (xT). karun.in. https://karun.in/blog/expected-threat.html
The post is undated; the earliest archived copy is from 22 February 2019.
[3] Tenga A, Holme I, Ronglan LT, Bahr R (2010). Effect of playing tactics on goal scoring in Norwegian professional soccer. Journal of Sports Sciences, 28(3), 237–244. https://doi.org/10.1080/02640410903502774
[4] Trainor C (2014, 30 July). Defensive metrics: Measuring the intensity of a high press. StatsBomb (now on Hudl’s blog). https://www.hudl.com/blog/defensive-metrics-measuring-the-intensity-of-a-high-press
[5] Lago-Peñas C, Dellal A (2010). Ball possession strategies in elite soccer according to the evolution of the match-score: The influence of situational variables. Journal of Human Kinetics, 25, 93–100. https://doi.org/10.2478/v10078-010-0036-z
[6] Brechot M, Flepp R (2020). Dealing with randomness in match outcomes: How to rethink performance evaluation in European club football using expected goals. Journal of Sports Economics, 21(4), 335–362. https://doi.org/10.1177/1527002519897962
Appendix A: methods
We used event data for every Scottish Premiership match from 2020/21 to 8 November 2026 (1,443 matches), with xG for every shot. Penalties are left out of every xG figure, which is why we write npxG.
A possession is a run of one team’s controlling actions: passes, take-ons, shots, touches, ball recoveries, interceptions, won tackles, goalkeeper pick-ups and claims, and being dispossessed. Duels, clearances, blocks, and fouls don’t end a possession, so if a team wins back a ball the opposition has cleared, it is still the same possession. A set-piece pass always starts a new one. Carries are inferred: when the same team’s next action comes within 10 seconds and at least 3 metres away, we assume the ball was carried between them.
Set pieces use the event data’s own labels for chances from corners, free kicks, and throw-ins, including the phase of play that follows them. For transitions and quick regains, the clock starts at the first controlling action of the possession, and the opposition’s passes are counted in the possession just before it. We didn’t use the event data’s own fast-break label, because the share of shots it tags has risen every season, from 1.9% in 2020/21 to 8.1% now, which looks like a change in how it is recorded rather than in how teams play.
Field tilt is a team’s share of both teams’ completed open-play passes in the final third. Pass share is a team’s share of all passes, leaving out throw-ins, crosses, and goalkeeper throws. PPDA divides the opposition’s passes in their own 60% of the pitch by the tackles, interceptions, challenges, and fouls made in the same area.
For the comparison against the same opponents, we took each Celtic match and subtracted the average of every other league team’s matches against that opponent in the same season. A positive number means Celtic did more than other teams did against the same opponents.
Expected threat uses our own 16 by 12 grid, fitted on the league’s matches from 2020/21 to 2025/26 with Karun Singh’s method [2]. Team totals add up every completed open-play pass and carry, including those that lose threat. The pitch maps, the chart of where Celtic move the ball, the passing pairs, and the comparison with market value count only the moves that add it, so backward passes don’t cancel out forward ones in the same area.
The intervals are 95% intervals from resampling each manager-season’s matches 2,000 times, unless stated otherwise.
Squad value is the sum of the players’ Transfermarkt values on 1 September, as a share of the whole league’s. For the starting XI, we valued each starter on the day of the match from their most recent valuation. Of 31,085 starters since 2020/21, 99.6% were matched to a Transfermarkt player and 98.6% had a value on the day. For each season, we fitted npxG difference in a match against the base-2 log of the ratio of the two XIs’ values, plus home advantage, on the other eleven teams’ matches only. Celtic’s figure is the average of their matches’ distances from that line, and its interval comes from the spread of those distances. Market values also follow results, so a team on a good run gains value. That will take a little away from Celtic’s figure.
Opponent strength is our own Elo rating before each match, on one scale across every league that has sent a club to Europe, as in Just Be Good. The ratings run to 16 October 2026, so for later matches we used each club’s latest rating. The lines are straight-line fits, one for 2020/21 to 2025/26 (272 matches) and one for this season (17).
Ages are each player’s age on the day of each league match, weighted by their minutes.
For the chart around Celtic’s goals, we split the time from 15 minutes before each of Celtic’s league goals to 20 minutes after into five-minute spells, and kept only those wholly inside the same half. The share is Celtic’s xT gains over both teams’. The bands come from resampling goals 500 times.
For the chances after each player wins or loses the ball, the player who won it is the player of the first action of the possession that led to the shot, and the player who lost it is the Celtic player whose action ended Celtic’s possession before the opposition’s shot. For the passing pairs, the receiver of a completed pass is the player of the next action when that player is a team-mate, which found a receiver for 98.9% of passes. The chart of where Celtic move the ball counts completed open-play passes and carries per match by the zone each starts in (six bands along the pitch, three across), and compares this season with the average of the four title-winning seasons.
The raw versions of the main measures, before the comparison against the same opponents, are below.
Appendix B: the transition definition
Our main definition counts a transition as a shot within 15 seconds of winning the ball from an opposition possession of three or more passes. To check that the result doesn’t depend on those two numbers, we tried every window from 5 to 30 seconds, in steps of five, with a minimum of one to five opposition passes, and with no minimum at all.
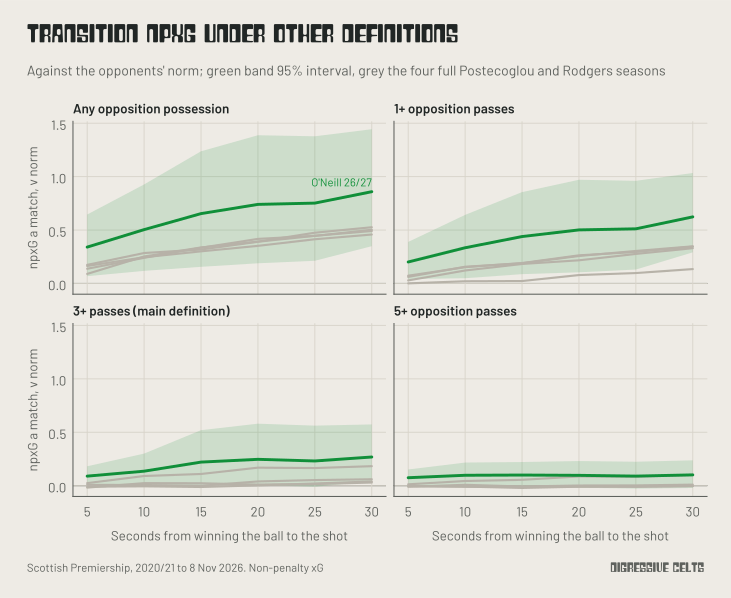
In all 30 settings with a minimum number of passes, this season’s side create more transition npxG, against the same opponents, than all four title-winning seasons, by up to 0.28 a match. The gap is widest with no minimum and a 30-second window (+0.86 against +0.53), and narrowest with five or more passes and a 30-second window, where the two are level to two decimal places (+0.10 each). Before any comparison against opponents, they have the most transition npxG per match of any of the league’s 84 team-seasons since 2020/21 in 35 of the 36 settings.
The 95% interval is wide in every setting. At 15 seconds and three passes, it runs from +0.01 to +0.52. The direction holds, but the size is uncertain.
Appendix C: small samples
Celtic’s npxG varies by about 1.03 a match from one match to the next within a manager-season (npxG against varies less, by about 0.47). An average over n matches therefore has a 95% interval of about plus or minus 1.96 × 1.03 divided by the square root of n: about 0.83 for six matches, 0.56 for 13, and 0.33 for 38.
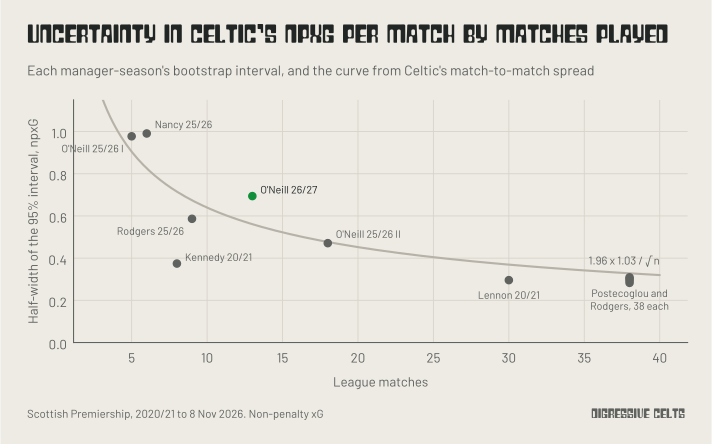
The intervals in this article match that closely. Nancy’s six matches give plus or minus 0.99, O’Neill’s five in late 2025 plus or minus 0.98, this season’s 13 plus or minus 0.69, and the full seasons between 0.28 and 0.31. Nancy’s is wider than the curve because those six matches varied more than usual.
The curve in the main text compares each team’s first n matches with its last 19, using the 60 team-seasons of 38 matches from 2020/21 to 2024/25, and shows the typical error per match.
Appendix D: data notes
Shots are up across the league this season. Between mid-July and 8 November, teams have taken 14.4 non-penalty shots per match in 2026/27, against between 11.8 and 12.8 at the same point of every season before. xG per shot (0.104) and xG by distance from goal haven’t moved, and goals per team per match (1.35) are within the range of earlier seasons (1.23 to 1.43). So teams are shooting more without scoring more. It is not a change in the xG model, but it could be a change in how shots are recorded. Either way, raw 2026/27 numbers flatter every team, which is why we compare against the same opponents.
European matches are left out of the league comparisons, because the opposition is so different. They are in the opponent-strength chart, where the ratings allow for it, and in the Europe chart, which uses expected threat because we have no xG for European matches before 2020/21. Celtic have played only four European matches this season.
Match scores include own goals. Goals split by how the chance began are counted from shots, so they leave out the two own goals in Celtic’s league matches this season.