 Digressive Celts
The Kids Are Alright: Peak Age and Celtic’s Recruitment Strategy
We followed 174,225 players through 22 seasons of European football to see when they peak on the pitch, in selection, and in the market, and what that means for Celtic’s recruitment strategy.
By Larry Nerd
Children don’t do well in athletic events. In fact, you very rarely see them compete at the Olympics. It is possible that this could be a lack of effort from the younger generations. However, it is much more likely that being physically underdeveloped is a moderate disadvantage.
Similarly, all past Olympic medal holders have one thing in common: they stopped winning medals. Maybe motivation dips once you’ve been there and done that, but—again—there’s probably a link to physical change. We’ll have to see how the current crop of Olympians does, but I suspect they won’t buck this trend.
This tells us something important. There’s some kind of sweet spot for physical activity. When we are either side of this—too young or too old—we are at a disadvantage. This is well-documented in football, with discussions of peak age: when is a player at their best?
But that isn’t the whole story.
The average age of the best beach volleyball players at the London 2012 Olympics was 30.5 years old for men and 28.3 for women, while the average age of the best artistic gymnasts at the same competition was 23.7 for men and 19.4 for women [1]. This suggests that there isn’t one single sweet spot for all physical activities.
This has been implicitly noted in football by separating peak age by position, and finding that it is lower for more intense and active positions (like wingers) and higher for more static positions (like centre backs).
This article puts numbers on these effects, looking at when performance changes happen and how player selection shifts on account of it, how player values develop because of it, and what traits and performance metrics are most affected. Finally, we discuss the implications of this for Celtic’s recruitment strategy.
The obvious place to start is to look at who actually plays.
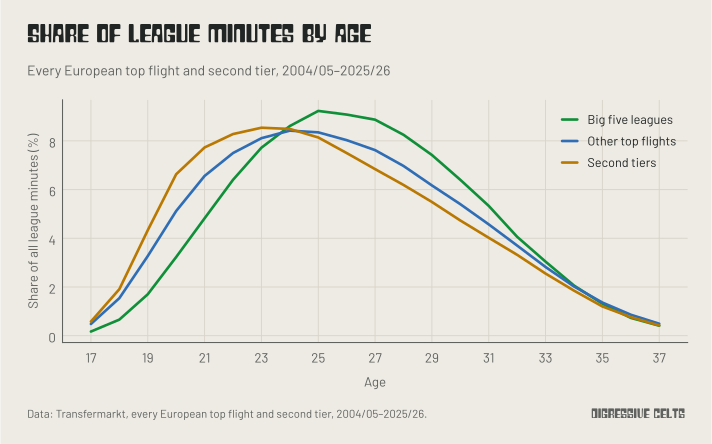
In the big five leagues, 25-year-olds play more minutes than players of any other age. In other top flights, it’s 24-year-olds, and in second tiers, 23-year-olds.
But this only looks at who is actually on the pitch. A 35-year-old that keeps being selected is probably very good, and most of their less good peers retired or moved to weaker leagues. They are likely an outlier player in terms of quality. Comparing these players to 25-year-olds, where we have all of the less good players still playing, is unfair.
Studies of ageing in baseball and ice hockey ran into the same issue. The fix is to compare each player with themselves [2, 3].
So that’s what we did. We followed 174,225 players through every men’s European top flight and second tier from 2004/05 to 2025/26, and asked how each player’s numbers changed as they got older. Further details are in Appendix A.
First, performance on the pitch.
For attacking players, goals and assists per 90 minutes peak at 26.7. WhoScored’s match rating, which scores everything a player does on the ball*, peaks at 26.1 for outfield players. An earlier study using the same ratings found that the average outfield player peaks between 25 and 27 [4].
However, we also want to see the shape of this over a player’s career. To do so, we used plus-minus*: how a side’s goal difference changes when a player is on the pitch, once their team-mates and opponents are taken into account [5]. Every effect here is goal difference per 90 minutes while they’re on the pitch (which we can call goals per game).
*A note on catch-all ratings, like that of WhoScored, and plus-minus values: these are typically quite poor for evaluating football performance. WhoScored ratings over-value the outcomes of on-ball actions specifically so players can be over-rated for getting a lucky goal, or being out of position so having to make lots of tackles, and there aren’t generally enough combinations of players switching in games to isolate a single player’s performance with plus-minus approaches due to a high number of players and low number of substitutions in football. However, comparing players only against themselves throughout their career lets us avoid using this to say how good they are, and isolate an effect change instead.
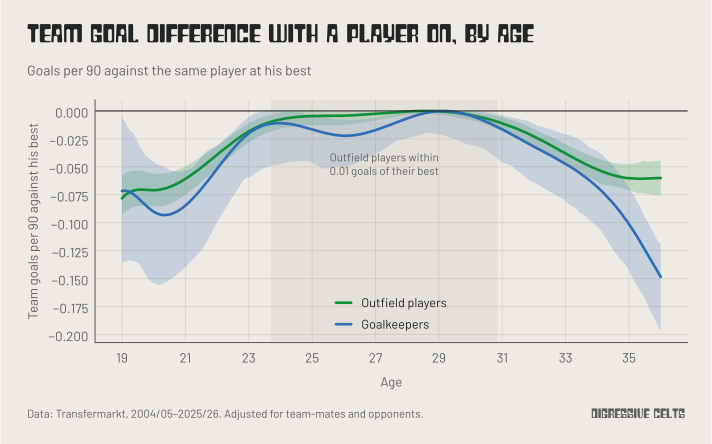
For outfield players, the top of the curve is flat. From about 24 to 31, a player is within 0.01 goals per game of their best, which is too small to tell apart. Then it falls: at 33, their side does 0.04 goals per game worse with them on than it did at their best, and at 35, 0.06 worse.
That’s small for one player, but it adds up. A side of eleven 33-year-olds would be about 0.4 goals per game worse than the same eleven at their best.
Goalkeepers hold their level for about as long, then fall faster. By 35, they’re 0.10 goals per game below their best. This is possibly because their decline has a much more direct impact on goal difference than outfield positions.
Ice hockey looks the same: forwards score at close to their best from about 24 to 32 [3].
Being good is not necessarily the same thing as being selected.
A manager can only pick the players in the squad, and a club can only sign players who are willing to come. So, we also looked at playing time: each player’s share of their club’s league minutes, and the strength of the club they played for, using the same Elo ratings as in Just Be Good.
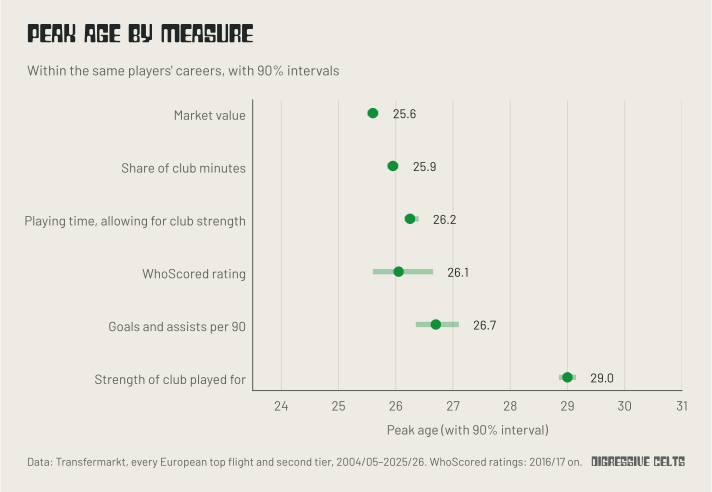
A player’s share of their club’s minutes peaks at 25.9. But the strength of the club they play for peaks three years later, at 29.0. Players tend to reach their biggest clubs after their best years have started.
Part of that is just how careers move. A player who does well moves to a stronger club, where they might play less. That naturally makes playing time peak earlier and club strength peak late.
To see how far each measure is thrown off, we simulated fake careers with a known peak and measured them in the same way as the real ones (Appendix B). Share of minutes came out early in every version, usually by one to three and a half years. Club strength came out late, by one to six years. A measure that combines both (a player’s playing time allowing for the strength of their club) came out closest: usually about half a year early, and never more than about a year out. In the real data, it peaks at 26.2.
None of this has changed in 20 years. In the big five leagues, the average age of league minutes has been between 26.8 and 27.1 in every season since 2004/05, and the peak within players hasn’t shifted either.
By position, the order is as expected.
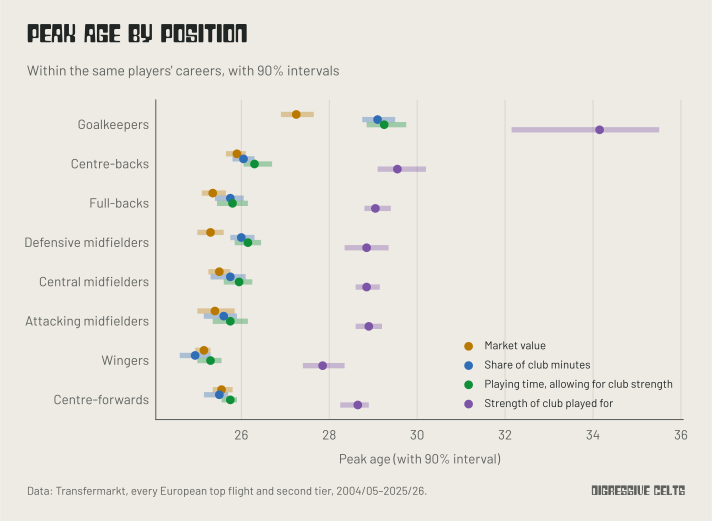
On playing time allowing for club strength, wingers peak earliest, at 25.3, and centre-backs the latest among outfield players, at 26.3. Full-backs, attacking midfielders, and centre-forwards come in at 25.8, central midfielders at 26.0, and defensive midfielders at 26.2. Goalkeepers are a different case: they peak at 29.3, and reach their strongest clubs at 34. A study of Champions League squads found the same order, with goalkeepers and centre-backs peaking later than attackers [6].
The gaps between outfield positions are small: about a year from earliest to latest. That’s much less than the gap between a gymnast and a beach volleyball player, but it points in the same direction. Across sports, peak age depends on what the event asks of the body, from about 20 in swimming to about 39 in ultra-distance cycling [7].
Part of how players last is by changing their role to something that isn’t as physically demanding.
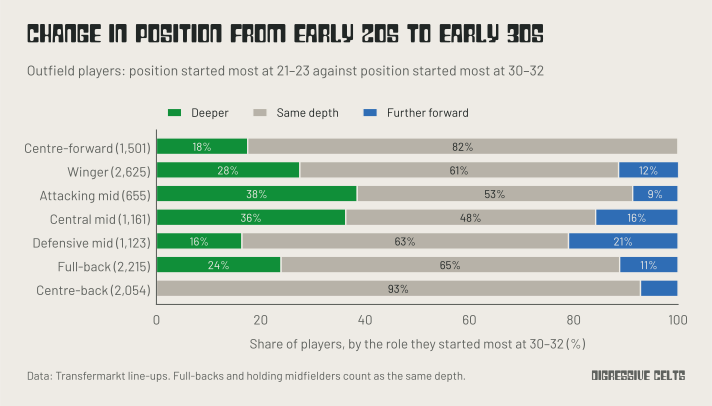
Of the players still starting at 30 to 32, 38% of those who were attacking midfielders in their early 20s had moved deeper, as had 36% of central midfielders and 28% of wingers. Nearly a quarter of full-backs became centre-backs. Centre-backs, with nowhere deeper to go, nearly all stayed where they were.
We can also look at how the market values players.
Transfermarkt gives nearly every professional player a value and these values predict transfer fees well [8]. We took each player’s value on matchdays, removed the general rise in the market, and followed each player’s value throughout their career.
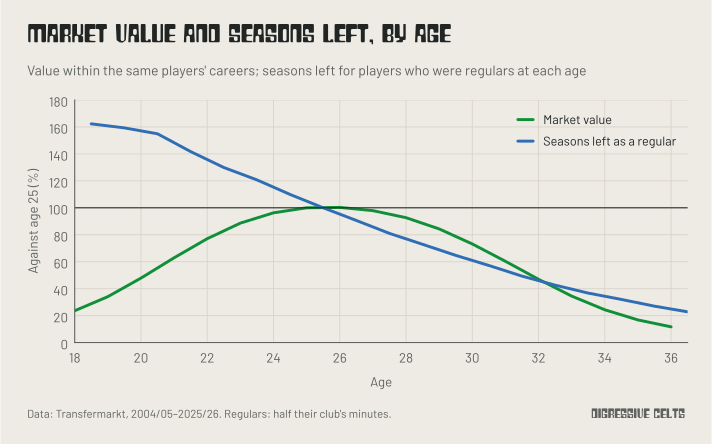
Value peaks at 25.6, before all of our performance measures. It doubles between 20 and 25, then halves between 26 and 32, while their effect on the pitch barely changes until 31. By 33, they’re worth about a third of their peak. Goalkeepers hold theirs longest: at 33, they’re still worth half of it.
The change that drives this is simply time remaining. A player who is a regular at 26 has, on average, about three more seasons as a regular ahead of them. At 32, they have fewer than one and a half. Like their value, that is approximately half.
So players’ prices comprise their quality and how much good football they have left. Before 25, the two diverge: a young player has more seasons ahead of them, but isn’t yet as good and their future quality is uncertain.
Buyers lean even further towards youth than Transfermarkt does.
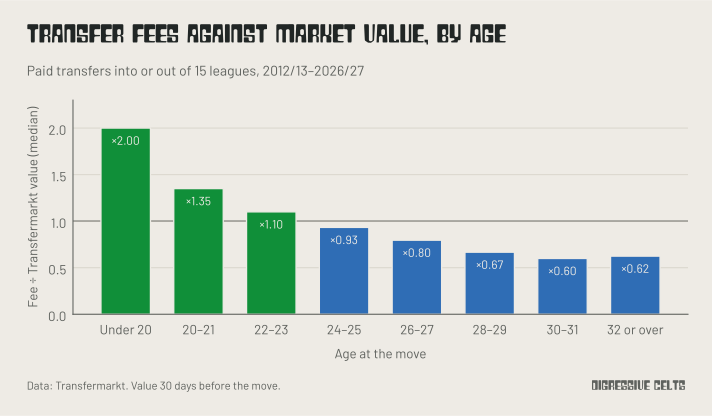
For players under 20, the median fee was twice their Transfermarkt value. For 30- and 31-year-olds, it was 60% of it. That holds when we compare players with the same value, the same time left on their contracts, and in the same season and window (and when Transfermarkt had updated the value just before the sale (Appendix C)). Fee models elsewhere find the same: all else being equal, a player a year younger costs about 12% more [9].
Half of all the money spent went on players aged 23 or under, before they reach their peak.
So, does the market get age wrong? To find out, we added each player’s price (their Transfermarkt value at the start of the season) to the plus-minus. Then we asked whether, at the same price, players of different ages do any better or worse on the pitch.
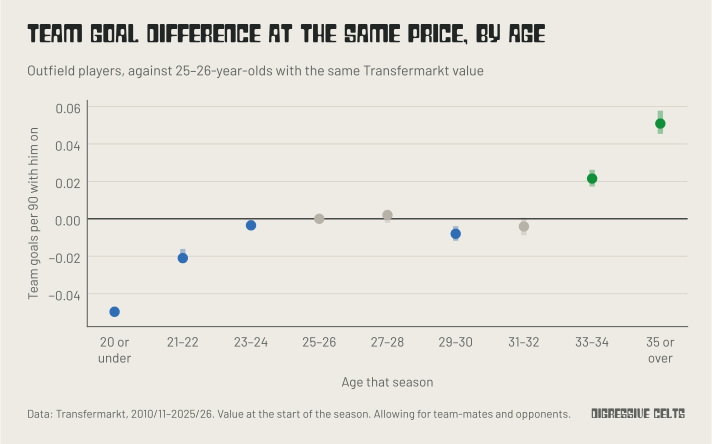
From 23 to 32, a player does about what their price suggests. Younger than that, they do less: at the same price, a side does 0.05 goals per game worse with a 20-year-old on than with a 25-year-old. That is the cost of potential.
From 33, it flips. At the same price, a 35-year-old adds 0.05 goals per game more than a 25-year-old: as much as a 25-year-old that costs double.
This doesn’t strictly mean that older players should be targeted, though. The 35-year-olds in our data are the ones still good enough to keep playing, and a regular at 35 has, on average, less than one more season as a regular left. But for short-term fixes with no return-on-investment, older players can offer cheaper solutions.
Transfer fees are only part of what a player costs, though. Wage data in football is patchy, so we couldn’t test this as extensively as we’d like, but in Major League Soccer, where every player’s salary is published, wages kept rising for several years after performance had peaked, and only fell away at the end of a career [10]. Younger players were paid less for the same performance, possibly because clubs can’t yet be sure how good they are and because they haven’t accumulated years of increasing raises. So some of the premium buyers pay for youth comes back in lower wages, and a player around 30 who is cheap to buy can still be expensive to keep.
Finally, we asked what skills players lose first.
For the leagues where we could source event data, we followed 15 skills from 2016/17, each measured against players in the same role, league, and season. Again, each player was compared with themselves.
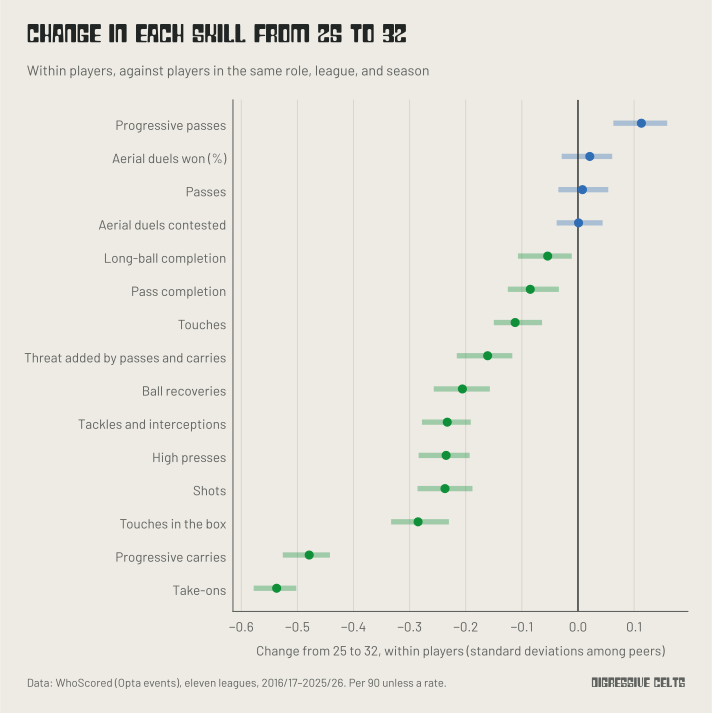
Legs go first. Between 25 and 32, take-ons fall the most, then progressive carries, and they start falling early: take-ons peak at about 20, and carries at 22. Getting into the box, shooting, pressing, tackling, and winning the ball back fall by about half as much.
Passing survives. Pass completion holds until the late 20s, the number of passes doesn’t change, and progressive passes keep rising into the 30s (which links to our finding about players moving deeper positionally). Studies with tracking data from Germany and Spain found that players over 30 cover less ground at high speed and sprint less [11, 12], and in Germany, their passing improved [11].
So, when is a footballer at their best?
On the pitch, for longer than you might guess: from about 24 to 31, with goalkeepers lasting longer still. In the market, earlier. Their value peaks in their mid-20s and halves by 32, because it’s priced on potential and remaining football. For fees, buyers lean younger still, making stronger bets on potential and return-on-investment.
This aligns well with Celtic’s strategy of buying young and selling. Their paid signings have a median age of 23.2. Their ten biggest sales were all of players aged 22 to 25, and nine of the ten went for more than their Transfermarkt value: Kristoffer Ajer at 23, for nearly four times his value. Those are the ages at which buyers pay most over the odds, years before the peak age plateau ends. The only player over 30 they’ve sold for a big fee, Kyogo Furuhashi, went for less than his value.
Older players are a specific niche in the market. At the same price, players aged 33 and over do more on the pitch than anyone (because those not able to are filtered out), but they come with no resale value and a potentially compounded salary. For a club that has to win the league every year as well as sell, both ends of the market have their uses.
However, the danger with older players is talent identification. These analyses are biased towards the players that manage to keep playing and don’t retire or move to significantly weaker leagues. Our results suggest that this is partly due to role adaptation: finding ways to lean on skills like passing rather than ball carrying, for instance.
In many teams, this can just mean moving older players into deeper roles. For Celtic, however, these roles can often be physically demanding. Celtic play with a very high line and possess much of the ball, so deeper players (like centre backs and defensive midfielders) have to manage transitions across large spaces. From 2020/21 to 2025/26, Celtic had 70% of the ball, more than any other side in our event data, Barcelona, Bayern Munich, and Manchester City included. Their centre-backs’ average touch was 41 metres from their own goal, four and a half metres further upfield than a typical side’s, and the ninth highest of 219 sides (Appendix D). Other clubs might be able to find efficiencies in older players with less consideration to style, but Celtic should think carefully about what they ask of post-peak players.
Players sustain a peak in their late 20s. More physically demanding tasks—roles like wingers that involve lots of quick dribbling—fade more quickly. As a consequence, players move deeper later in their careers to lean on more evergreen skills, like passing.
Some fans might have the perception that buying young is buying cheap. This is not true. Buying young comes at a premium for the money you might make in the future. Celtic typically do this quite well, selling players as they hit their peak years for big returns. But fees aren’t the whole bill. Across Europe’s top flights, clubs paid about twice as much in player wages in 2022 as transfers cost them [13], so it’s the wage bill that limits most squads. Younger players are paid less for what they do, which wins back some of the premium on their fees. If salaries are managed well, older players can be a cost-efficient tool for solving specific problems, but one that Celtic should be wary of given the specific roles they have for deeper players compared to other clubs.
References
[1] Longo AF, Siffredi CR, Cardey ML, Aquilino GD, Lentini NA (2016). Age of peak performance in Olympic sports: A comparative research among disciplines. Journal of Human Sport and Exercise, 11(1), 31–41. https://doi.org/10.14198/jhse.2016.111.03
[2] Fair RC (2008). Estimated age effects in baseball. Journal of Quantitative Analysis in Sports, 4(1), article 1. https://doi.org/10.2202/1559-0410.1074
[3] Brander JA, Egan EJ, Yeung L (2014). Estimating the effects of age on NHL player performance. Journal of Quantitative Analysis in Sports, 10(2), 241–259. https://doi.org/10.1515/jqas-2013-0085
[4] Dendir S (2016). When do soccer players peak? A note. Journal of Sports Analytics, 2(2), 89–105. https://doi.org/10.3233/JSA-160021
[5] Kharrat T, McHale IG, López Peña J (2020). Plus–minus player ratings for soccer. European Journal of Operational Research, 283(2), 726–736. https://doi.org/10.1016/j.ejor.2019.11.026
[6] Kalén A, Rey E, Sal de Rellán-Guerra A, Lago-Peñas C (2019). Are soccer players older now than before? Aging trends and market value in the last three decades of the UEFA Champions League. Frontiers in Psychology, 10, 76. https://doi.org/10.3389/fpsyg.2019.00076
[7] Allen SV, Hopkins WG (2015). Age of peak competitive performance of elite athletes: A systematic review. Sports Medicine, 45(10), 1431–1441. https://doi.org/10.1007/s40279-015-0354-3
[8] Herm S, Callsen-Bracker H-M, Kreis H (2014). When the crowd evaluates soccer players’ market values: Accuracy and evaluation attributes of an online community. Sport Management Review, 17(4), 484–492. https://doi.org/10.1016/j.smr.2013.12.006
[9] Poli R, Besson R, Ravenel L (2022). Econometric approach to assessing the transfer fees and values of professional football players. Economies, 10(1), 4. https://doi.org/10.3390/economies10010004
[10] Scarfe R, Singleton C, Sunmoni A, Telemo P (2024). The age-wage-productivity puzzle: Evidence from the careers of top earners. Economic Inquiry, 62(2), 584–606. https://doi.org/10.1111/ecin.13191
[11] Sal de Rellán-Guerra A, Rey E, Kalén A, Lago-Peñas C (2019). Age-related physical and technical match performance changes in elite soccer players. Scandinavian Journal of Medicine & Science in Sports, 29(9), 1421–1427. https://doi.org/10.1111/sms.13463
[12] Rey E, Costa PB, Corredoira FJ, Sal de Rellán Guerra A (2023). Effects of age on physical match performance in professional soccer players. Journal of Strength and Conditioning Research, 37(6), 1244–1249. https://doi.org/10.1519/JSC.0000000000003244
[13] UEFA (2024). The European Club Finance and Investment Landscape. UEFA, Nyon. https://editorial.uefa.com/resources/028a-1a4669b3fd84-38a84630b77b-1000/uefaeuropeanclubfinanceinvestmentlandscape_150224.pdf
[14] Dvorak J, George J, Junge A, Hodler J (2007). Application of MRI of the wrist for age determination in international U-17 soccer competitions. British Journal of Sports Medicine, 41(8), 497–500. https://doi.org/10.1136/bjsm.2006.033431
[15] Mills JP, Ing C, Markham T, Guppy F (2018). It is not Black and White: A comparison of skin tone by playing position in the Premier League and English football. International Journal of Sports Science & Coaching, 13(3), 398–404. https://doi.org/10.1177/1747954117749747
[16] McLoughlin D (2020). Racial bias in football commentary: The pace and power effect. RunRepeat, with the Professional Footballers’ Association. https://runrepeat.com/racial-bias-study-soccer
Appendix A: data and method
Data. We took line-ups, substitutions, goals, birth dates, positions, and values from Transfermarkt for every European top flight and second tier from 2004/05 to 2025/26. We kept the league seasons in which at least 90% of sides had full line-ups recorded: 380,747 matches in 2,325 league seasons, with 10.7 million appearances by 174,225 players. Ages are exact to the day, and a season’s age is taken at its middle.
Positions. Each player has one career position: the one they started most league minutes in, where line-ups give positions, or otherwise the one on their profile. Wide midfielders count as wingers, and second strikers as attacking midfielders.
Age curves. For each measure, a player’s number in a season is their own usual level plus a smooth curve in age. Because each player’s own level is taken out, the curve only learns from players getting older rather than from comparing one player with another. The peak is the top of the curve. The 90% intervals come from refitting it 300 times on resamples of players.
Share of club minutes: a player’s share of their club’s league minutes, with a zero for any season between their first and last in which they weren’t in a squad in these leagues.
Strength of club played for: the Elo rating of a player’s club before each match, weighted by their minutes.
Playing time allowing for club strength: a player’s share of minutes with the strength of their club held fixed, put on the Elo scale. A fall of 100 means they get the playing time they would have lost by moving to a club 100 points stronger.
Market value: a player’s median Transfermarkt value on matchdays that season, less the big five’s average for players aged 22 to 30 that season, which takes out the rise in the market.
Goals and assists per 90 minutes: attacking midfielders, wingers, and centre-forwards with 450 or more minutes in a season, after league differences. Transfermarkt doesn’t mark penalties consistently in all leagues, so they’re included.
Robustness. The peaks for outfield players moved by less than half a year when we left out the zero seasons, used top flights only, kept only players with eight or more seasons, used only positions from line-ups, started from 2012/13, or let the curve bend more often.
Seasons left. For players who were regulars at each age (half or more of their club’s league minutes), we counted the further seasons in which they were regulars in these leagues. We used players born in 1988 or earlier, so their careers are seen to the end. A season in another league counts as zero, so this is seasons left in Europe’s top two tiers. In the chart, value is the curve within players, and seasons left is an average over players, both against age 25.
Appendix B: the fake-data simulation
Different measures give different peaks, so we needed to know which to trust. We built a fake world in which we knew the true peak, and measured it the same way as the real one.
In it, each player has a lasting ability and a known age curve, which falls faster after the peak than it rises, plus form from season to season. Clubs have a fixed number of places, filled by reputation, which follows last season’s ability with a lag. Each season, a player moves to the club their reputation would put them at with a 40% chance, about as often as real players change clubs (39.8% a season in our data). Managers pick on current ability, with some noise, and players start retiring after 32. We ran seven versions of this world with different peaks and settings.
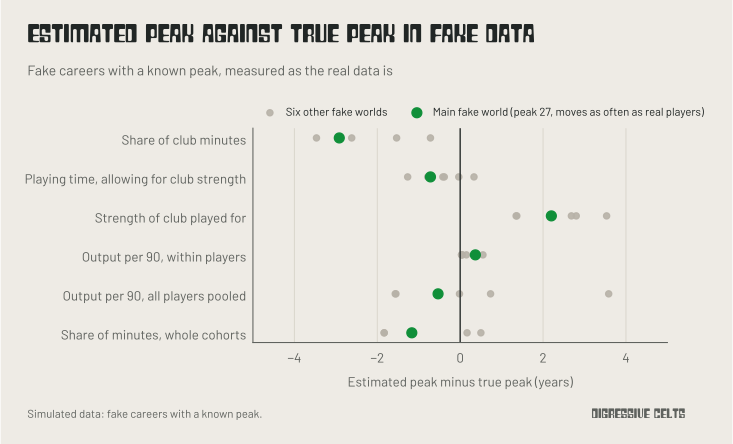
Share of minutes is early in every world, because good players move up to clubs where they play less. Club strength is late, because reputation lags and moves are sticky. Playing time allowing for club strength was within about a year in every world, usually half a year early. Output per 90 minutes, comparing each player with themselves, was the most accurate, within 0.6 years. Comparing different players instead, without following each one, could be wrong by years in either direction.
Appendix C: plus-minus, prices, and fees
Plus-minus. We split about 380,000 league matches into 2.35 million stretches between changes of players, keeping only matches whose recorded goals add up to the score (to remove games with poor data collection or other issues). In each stretch, the home side’s goal difference per 90 minutes is home advantage, plus what each home player adds, minus what each away player adds. Players with 900 or more league minutes (94,587 of them) each get their own effect, plus an age curve. The rest are pooled by position with no age curve, so the curve comes only from players followed through their careers. The intervals come from 100 refits on resamples of matches.
Price and age. For the seasons from 2010/11, when values cover 85% or more of minutes, we fitted the plus-minus again without each player’s own effect. Instead, each player adds a slope on their price (their Transfermarkt value at their first league match of the season, on a log scale, for their position) and an effect for their age that season. So each age’s effect is what players of that age add against 25- and 26-year-olds at the same price. For scale, a player valued twice as high adds about 0.05 goals per game.
We also fitted it with an effect for every team in every season, so that players are only compared with their team-mates. The results were the same to within 0.005 goals per game. The intervals come from 40 refits on resamples of matches. In a placebo test on the same plus-minus, with player roles dealt out at random among players in the same position, intervals like these came out about a third too narrow. Widened by that much, every age outside 23 to 32 is still clearly different from zero.
Fees. We took 17,666 paid transfers into or out of 15 leagues from summer 2012 to summer 2026: the Premier League, the Championship, LaLiga, Serie A, the Bundesliga, Ligue 1, the Scottish Premiership, and the top flights of Portugal, the Netherlands, Belgium, Turkey, Austria, Switzerland, Denmark, and Brazil. We divided each fee by the player’s Transfermarkt value 30 days before the move.
Holding the value, the time left on the contract, the season, and the window fixed gives the same pattern. Against 24- and 25-year-olds, under-20s went for 2.25 times as much relative to their value, and 30- and 31-year-olds for two-thirds as much. Using only values that Transfermarkt had updated in the 90 days before the move (8,682 transfers), so that a value that hadn’t caught up can’t explain it, those figures are 2.0 and 0.70.
Appendix D: skills
We sourced event data for eleven European leagues: the top five, the Championship, the Eredivisie, Liga Portugal, and the Süper Lig from 2016/17, and Belgium and Scotland from 2020/21, all to 2025/26. That’s 36,076 matches. A player-season is one league season in one role (grouped position labels) with 900 or more minutes, which gives 8,324 outfield players.
Each skill is per 90 minutes, or a success rate, turned into standard deviations against players in the same role, league, and season. The curves compare each player with themselves, with an allowance for the league they played in, so that a move to a stronger league isn’t read as decline. Adding Brazil’s Série A as a check changed no skill’s change from 25 to 32 by more than 0.02.
Celtic’s style. From the same events, for 2020/21 to 2025/26, possession is a side’s share of the passes in its matches, and how high its centre-backs play is the average distance of their touches from their own goal line, for players who started at centre-back. We compared the 219 sides with three or more of those seasons in these leagues. Celtic’s defensive actions as a whole were the 19th highest (39.8 metres from goal, against 36.3 for the median side). Sides with more of the ball play higher: Celtic’s centre-backs play about as high as their possession would predict, and their defensive actions a little lower.
Appendix E: other factors
We also checked whether anything shifts the curve. These checks are exploratory.
Era. For outfield players, playing time allowing for club strength peaked within a quarter of a year of the same age in 2004/05–2010/11, 2011/12–2017/18, and 2018/19–2025/26.
Height and foot. No difference: every peak was within 0.3 years of the others.
Early minutes. Players used heavily before 21 stopped rising sooner and fell faster afterwards, by more than regression to the mean produced in a fake world where early minutes did nothing. But that fake world isn’t calibrated for this question, so it’s not a finding we could be confident in and possibly a direction for future work.
Birthplace.
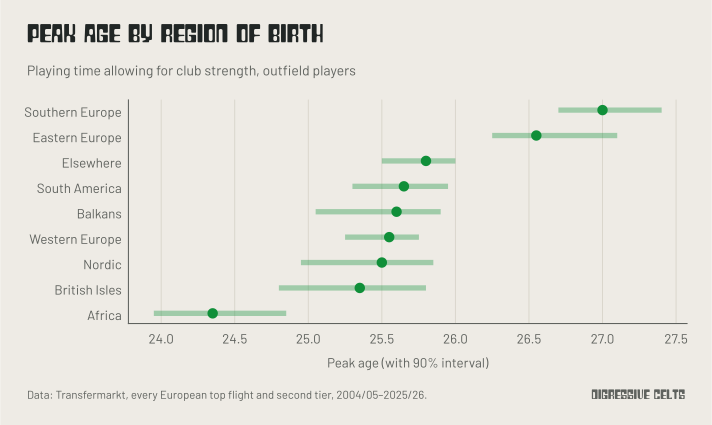
Players born in Africa peak earliest, at 24.4, and fall fastest afterwards: 1.8 times as far from 25 to 33 as the average player. An early peak and a steep fall are what you’d see if some players’ ages were understated, which has been documented in youth football [14]. It could also be due to many other reasons, including selection biases surrounding those who move into European football, or racial biases shoehorning non-white players into more physical roles [15, 16], which we know peak earlier, so this can only be interpreted as a pattern rather than anything concrete.